Analysing structured log files with simple tools
Published:
Updated:
Some tools and other notes when you just want to analyze your structured log files locally using simple tools with a focus for newline-delimited JSON (NDJSON) / JSON lines / JSON Text Sequences.
Table of Content
Tools
Standard tools
Many line-oriented tools work OK if your log files are NDJSON:
grep, can be used filtering (but tools suchjqmight more convenient and more useful for JSON logs);head -n $count;tail -n $count;tail -fand (usually better)tail -Ffor following files;less;less -r(preserve colors);shuf -n $count, take random samples.
jq
jq is very useful for processing JSON data:
- reformat and colorize (forced with
-C) JSON entries by default; - can be used for (complex) filtering (
jq 'select(.level_value > 30000)'), transformations, etc.; - can compute new fields (
jq '. * {ts: .timestamp | fromdateiso8601}'); - works with NDJSON / JSON lines by default;
- can work with JSON seq (
--seq).
You can convert JSON log files with JSON filters such as (using ANSI escape codes for colors):
(if .level == "ERROR" then "\u001b[1;31m" elif .level == "WARN" then "\u001b[1;33m" else "" end)
+ .timestamp
+ " "
+ .level
+ " "
+ "["
+ .thread
+ "] "
+ .message
+ ( if .level == "ERROR" or .level == "WARN" then "\u001b[1;0m" else "" end)
+ "\n"
+ (if .exception then .exception else "" end)
Which can be used with something like:
tail -F app.json | jq -j -f log.jq | less -r
VisiData
VisiData is a Text User Interface (TUI) explorer for tabular data. It can take a lot of different formats as input and works quite well with NDJSON logs. It can be used for filtering data, sorting data, generating descriptive statistics and pivot tables, typing columns, summarizing data, creating pivot tables, generate simple plot (text-oriented), etc.
pandas
pandas is a Python DataFrame library:
- great support for processing time series and plotting them;
- can read and write NDJSON data and many other data formats;
- can very conveniently filter and transform tabular data;
- can be combined with matplotlib for plotting tabular data;
We can even plot directly on the terminal using some additional plugins, using either the iTerm image protocol, the kitty image protocol or the Sixel image protocol (it supported by the terminal).
Highlights:
pandas.read_json()for pargins JSON;data.set_index("timestamp");data.sample()for taking random samples;data.tz_convert("Europe/Paris")for changing the timezone;data["field"].resample("1H").mean(), aggregation;data[data["field"] >= 100]for filtering;data.plot();data.to_json();data.head(10);data.tail(10).
Example: taking random samples
import pandas as pd
data = pd.read_json('logs.json', lines=True).set_index("timestamp")
data[["path"]].sample(30)
                                                                        path
timestamp
2023-02-10 18:38:16+00:00                 /fonts/SourceCodePro-Semibold.woff
2023-02-10 10:38:44+00:00                       /img/oauth2-bearer-token.svg
2023-02-10 20:31:45+00:00                  /fonts/SourceCodePro-Regular.woff
2023-02-10 11:18:33+00:00                    /fonts/SourceSerifPro-Bold.woff
2023-02-10 03:56:44+00:00                                         /feed.atom
2023-02-10 13:58:45+00:00                                      /css/main.css
2023-02-10 04:56:04+00:00                /fonts/SourceSerifPro-Semibold.woff
2023-02-10 09:16:45+00:00                                         /feed.atom
2023-02-10 11:48:36+00:00               /2021/06/02/dns-rebinding-explained/
2023-02-10 10:37:17+00:00                            /2014/05/23/flamegraph/
2023-02-10 20:12:15+00:00                                /2021/05/08/tuntap/
2023-02-10 13:29:16+00:00                                           /page/3/
2023-02-09 23:10:55+00:00                                      /css/main.css
2023-02-10 14:28:13+00:00                                        /tags/perf/
2023-02-10 08:44:46+00:00                             /2015/05/29/core-file/
2023-02-10 13:36:00+00:00                      /2016/10/18/terminal-sharing/
2023-02-10 14:15:26+00:00                                    /2019/feed.json
2023-02-10 15:28:01+00:00                                        /js/main.js
2023-02-10 20:31:03+00:00                    /img/android-emulator-proxy.png
2023-02-10 14:45:01+00:00  /2022/06/07/impact-of-the-different-wifi-secur...
2023-02-10 13:42:43+00:00                                        /tags/wifi/
2023-02-10 13:42:51+00:00                        /tags/dns-rebinding/page/2/
2023-02-10 10:31:32+00:00                                  /img/wpa2-eap.svg
2023-02-10 01:50:34+00:00                                      /css/main.css
2023-02-10 15:28:06+00:00                  /fonts/SourceCodePro-Regular.woff
2023-02-10 22:11:38+00:00                                /2021/05/08/tuntap/
2023-02-10 06:27:46+00:00                 /fonts/SourceSerifPro-Regular.woff
2023-02-10 08:00:55+00:00                                      /css/main.css
2023-02-10 08:44:45+00:00                                        /js/main.js
2023-02-10 14:29:41+00:00                               /tags/perf/feed.json
Example: aggregation
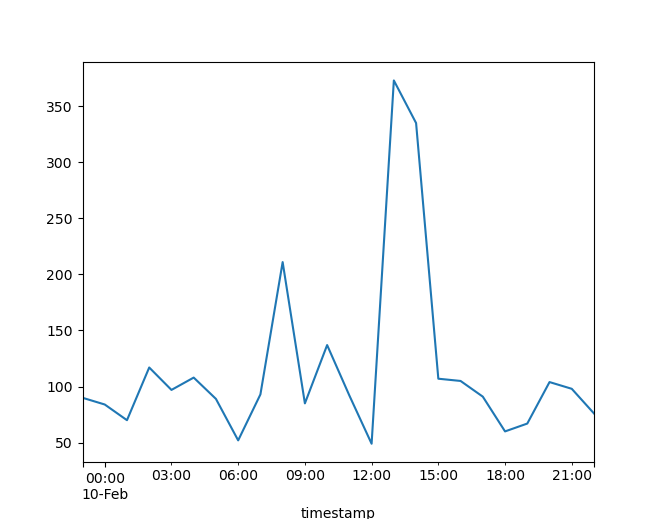
data.resample("1H").size()
timestamp
2023-02-09 23:00:00+00:00     90
2023-02-10 00:00:00+00:00     84
2023-02-10 01:00:00+00:00     70
2023-02-10 02:00:00+00:00    117
2023-02-10 03:00:00+00:00     97
2023-02-10 04:00:00+00:00    108
2023-02-10 05:00:00+00:00     89
2023-02-10 06:00:00+00:00     52
2023-02-10 07:00:00+00:00     93
2023-02-10 08:00:00+00:00    211
2023-02-10 09:00:00+00:00     85
2023-02-10 10:00:00+00:00    137
2023-02-10 11:00:00+00:00     92
2023-02-10 12:00:00+00:00     49
2023-02-10 13:00:00+00:00    373
2023-02-10 14:00:00+00:00    335
2023-02-10 15:00:00+00:00    107
2023-02-10 16:00:00+00:00    105
2023-02-10 17:00:00+00:00     91
2023-02-10 18:00:00+00:00     60
2023-02-10 19:00:00+00:00     67
2023-02-10 20:00:00+00:00    104
2023-02-10 21:00:00+00:00     98
2023-02-10 22:00:00+00:00     76
Freq: H, dtype: int64
Example: plotting
import matplotlib.pyplot as plt

data.resample("1H").size().plot()
plt.show()

polars
polars is another (Python and Rust) DataFrame library which may be useful in order to achieve greater performance. The syntax is quite more verbose and probably not as useful for quick analyses. Pandas is probably more useful for one-shot ad hoc analysis.
Highlights:
polars.read_ndjson("logs.json");data.group_by_dynamic("timestamp", every="1h", period="1h").agg(...);data.sample(10),data.head10),data.tail(10), etc.
Example: aggregation
import polars as pl

pl.Config.set_tbl_rows(-1)

data = pl.read_ndjson("logs.json")
data = data.with_columns(pl.col("timestamp").str.to_datetime())
z = data.sort("timestamp").group_by_dynamic("timestamp", every="1h", period="1h", closed="left").agg(pl.count())
z
shape: (24, 2)
┌─────────────────────────┬───────┐
│ timestamp               ┆ count │
│ ---                     ┆ ---   │
│ datetime[μs, UTC]       ┆ u32   │
╞═════════════════════════╪═══════╡
│ 2023-02-09 23:00:00 UTC ┆ 90    │
│ 2023-02-10 00:00:00 UTC ┆ 84    │
│ 2023-02-10 01:00:00 UTC ┆ 70    │
│ 2023-02-10 02:00:00 UTC ┆ 117   │
│ 2023-02-10 03:00:00 UTC ┆ 97    │
│ 2023-02-10 04:00:00 UTC ┆ 108   │
│ 2023-02-10 05:00:00 UTC ┆ 89    │
│ 2023-02-10 06:00:00 UTC ┆ 52    │
│ 2023-02-10 07:00:00 UTC ┆ 93    │
│ 2023-02-10 08:00:00 UTC ┆ 211   │
│ 2023-02-10 09:00:00 UTC ┆ 85    │
│ 2023-02-10 10:00:00 UTC ┆ 137   │
│ 2023-02-10 11:00:00 UTC ┆ 92    │
│ 2023-02-10 12:00:00 UTC ┆ 49    │
│ 2023-02-10 13:00:00 UTC ┆ 373   │
│ 2023-02-10 14:00:00 UTC ┆ 335   │
│ 2023-02-10 15:00:00 UTC ┆ 107   │
│ 2023-02-10 16:00:00 UTC ┆ 105   │
│ 2023-02-10 17:00:00 UTC ┆ 91    │
│ 2023-02-10 18:00:00 UTC ┆ 60    │
│ 2023-02-10 19:00:00 UTC ┆ 67    │
│ 2023-02-10 20:00:00 UTC ┆ 104   │
│ 2023-02-10 21:00:00 UTC ┆ 98    │
│ 2023-02-10 22:00:00 UTC ┆ 76    │
└─────────────────────────┴───────┘
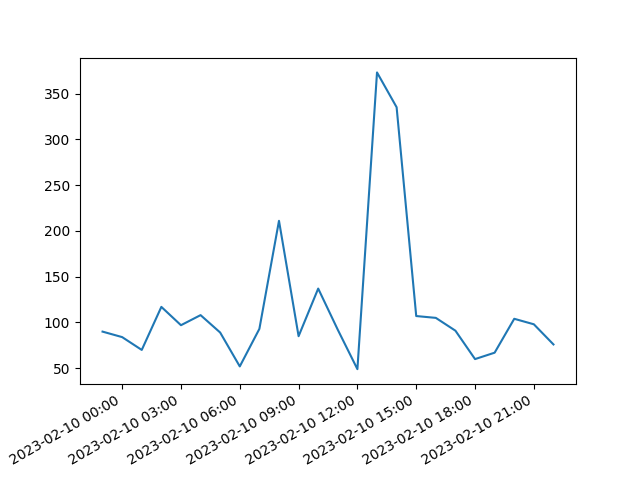
Example: plotting
import matplotlib.pyplot as plt
import matplotlib.dates as mdates

fig = plt.figure()
ax = plt.plot(z["timestamp"], z["count"])[0].axes
ax.xaxis.set_major_formatter(mdates.DateFormatter('%Y-%m-%d %H:%M'))
fig.autofmt_xdate()
plt.show()

DuckDB
DuckDB in an in-memory database for data analysis (OLAP) with a SQL interface. It can use a lot of different formats and works quit well with NDJSON logs. See for example Shredding Deeply Nested JSON, One Vector at a Time.
PRQL (Pipelined Relational Query Language) can be used with DuckDB with a extension. It might be more convenient than SQL for complex analysis. It did not try this.
Harlequin is a TUI IDE for DuckDB (based on the awesome Textual library).
Example: raking random samples
CREATE TABLE logs AS SELECT * FROM read_ndjson_auto("logs.json");
select timestamp, path from logs USING SAMPLE 25;
┌─────────────────────┬──────────────────────────────────────────────────────────────────┐
│      timestamp      │                               path                               │
│      timestamp      │                             varchar                              │
├─────────────────────┼──────────────────────────────────────────────────────────────────┤
│ 2023-02-10 20:57:47 │ /feed.atom                                                       │
│ 2023-02-10 00:12:45 │ /js/main.js                                                      │
│ 2023-02-10 09:40:19 │ /fonts/SourceCodePro-Regular.woff                                │
│ 2023-02-10 03:40:17 │ /2022/03/15/dns-rebinding-readymedia/                            │
│ 2023-02-10 10:31:22 │ /fonts/SourceSerifPro-Semibold.woff                              │
│ 2023-02-10 04:23:31 │ /img/tls-1.3-summary.svg                                         │
│ 2023-02-10 01:13:35 │ /                                                                │
│ 2023-02-10 13:58:45 │ /2022/08/28/trying-to-run-stable-diffusion-on-amd-ryzen-5-5600g/ │
│ 2023-02-10 22:30:30 │ /fonts/SourceSerifPro-Semibold.woff                              │
│ 2023-02-09 23:30:25 │ /feed.atom                                                       │
│ 2023-02-10 18:38:16 │ /fonts/SourceCodePro-Regular.woff                                │
│ 2023-02-10 13:10:43 │ /fonts/SourceSerifPro-Bold.woff                                  │
│ 2023-02-10 07:30:24 │ /feed.atom                                                       │
│ 2023-02-10 20:12:16 │ /favicon.ico                                                     │
│ 2023-02-10 03:32:25 │ /feed.atom                                                       │
│ 2023-02-10 04:23:20 │ /2022/02/07/selenium-standalone-server-csrf-dns-rebinding-rce/   │
│ 2023-02-10 22:27:45 │ /tags/hack/feed.atom                                             │
│ 2023-02-10 14:36:58 │ /fonts/SourceSerifPro-Regular.woff                               │
│ 2023-02-10 13:40:00 │ /tags/dns-rebinding/                                             │
│ 2023-02-10 05:49:12 │ /js/main.js                                                      │
│ 2023-02-10 10:16:02 │ /js/main.js                                                      │
│ 2023-02-10 19:46:34 │ /js/main.js                                                      │
│ 2023-02-10 14:17:20 │ /tags/wifi/feed.atom                                             │
│ 2023-02-10 16:23:03 │ /fonts/SourceSerifPro-Semibold.woff                              │
│ 2023-02-10 13:28:16 │ /2015/11/25/rr-use-after-free/                                   │
├─────────────────────┴──────────────────────────────────────────────────────────────────┤
│ 25 rows                                                                      2 columns │
└────────────────────────────────────────────────────────────────────────────────────────┘
Example: aggregation
select time_bucket(INTERVAL 1 HOUR, timestamp), count(*) from logs group by all;
┌───────────────────────────────────────────────────────┬──────────────┐
│ time_bucket(to_hours(CAST(1 AS BIGINT)), "timestamp") │ count_star() │
│                       timestamp                       │    int64     │
├───────────────────────────────────────────────────────┼──────────────┤
│ 2023-02-09 23:00:00                                   │           90 │
│ 2023-02-10 00:00:00                                   │           84 │
│ 2023-02-10 01:00:00                                   │           70 │
│ 2023-02-10 02:00:00                                   │          117 │
│ 2023-02-10 03:00:00                                   │           97 │
│ 2023-02-10 04:00:00                                   │          108 │
│ 2023-02-10 05:00:00                                   │           89 │
│ 2023-02-10 06:00:00                                   │           52 │
│ 2023-02-10 07:00:00                                   │           93 │
│ 2023-02-10 08:00:00                                   │          211 │
│ 2023-02-10 09:00:00                                   │           85 │
│ 2023-02-10 10:00:00                                   │          137 │
│ 2023-02-10 11:00:00                                   │           92 │
│ 2023-02-10 12:00:00                                   │           49 │
│ 2023-02-10 13:00:00                                   │          373 │
│ 2023-02-10 14:00:00                                   │          335 │
│ 2023-02-10 15:00:00                                   │          107 │
│ 2023-02-10 16:00:00                                   │          105 │
│ 2023-02-10 17:00:00                                   │           91 │
│ 2023-02-10 18:00:00                                   │           60 │
│ 2023-02-10 19:00:00                                   │           67 │
│ 2023-02-10 20:00:00                                   │          104 │
│ 2023-02-10 21:00:00                                   │           98 │
│ 2023-02-10 22:00:00                                   │           76 │
├───────────────────────────────────────────────────────┴──────────────┤
│ 24 rows                                                    2 columns │
└──────────────────────────────────────────────────────────────────────┘
lnav
lnav provides navigation for many log file formats. It features:
- hotkeys for chronological navigation,
- remote file loading,
- SQL filtering (based on SQLite),
- support custom file formats including NDJSON logs,
- etc.
Other tools
jl provides pretty printing of several JSON log formats.
Logging frameworks and libraries
journald
journalctl can export journald logs to NDJSON form with journalctl -o json. See systemd.journal-fields for a description of typical fields in journald logs.
Combined Log Format
We can convert Combined (access) Log Format to NDJSON with a script such as:
#!/usr/bin/python3

import click
from typing import List, Optional, Any, Callable
import re
import sys
from io import TextIOBase
from re import Pattern
from json import dumps
from datetime import datetime, date
from ipaddress import ip_address, IPv4Address, IPv6Address
from dateutil.tz import gettz
from datetime import timezone


def json_mapper(obj):
    if isinstance(obj, (datetime, date)):
        res = obj.isoformat()
        if obj.tzinfo is timezone.utc:
            res = res.replace("+00:00", "Z")
        return res
    if isinstance(obj, (IPv4Address, IPv6Address)):
        return str(obj)
    raise TypeError("No serialization for %s" % type(obj))


def parse_int(value: str) -> Optional[int]:
    if value == "-":
        return None
    return int(value)


tz = timezone.utc


def parse_date(value: str) -> datetime:
    return datetime.strptime(value, "%d/%b/%Y:%H:%M:%S %z").astimezone(tz)


class Field:
    name: str
    regex: str
    converter: Callable[[str], Any] | None

    def __init__(
        self, name: str, regex: str, converter: Callable[[str], Any] | None = None
    ) -> None:
        self.name = name
        self.regex = regex
        self.converter = converter


class Format:
    _tokens: List[Field | str]
    _fields: List[Field]
    _pattern = Pattern

    def __init__(self, tokens: List[Field | str]) -> None:
        self._tokens = tokens

        regex_string = (
            "^"
            + "".join(
                ("(" + token.regex + ")") if isinstance(token, Field) else token
                for token in tokens
            )
            + "$"
        )
        self._pattern = re.compile(regex_string)

        self._fields = [token for token in tokens if isinstance(token, Field)]

    def parse(self, data: str) -> Optional[dict]:
        match = self._pattern.match(data)
        if match is None:
            return None
        groups = match.groups()
        return {
            field.name: field.converter(groups[i])
            if field.converter is not None
            else groups[i]
            for i, field in enumerate(self._fields)
        }


COMBINED_FORMAT = Format(
    [
        Field("remote_addr", "[^ ]+", converter=ip_address),
        " [^ ]+ ",
        Field("remote_user", "[^ ]+"),
        " \[",
        Field("timestamp", "[^]]+", converter=parse_date),
        '\] "',
        Field("method", "[^ ]+"),
        " ",
        Field("path", '[^ "]+'),
        " ",
        Field("protocol", '[^ "]+'),
        '" ',
        Field("status", "[-0-9]+", converter=parse_int),
        " ",
        Field("body_bytes_sent", "[-0-9]+", converter=parse_int),
        ' "',
        Field("http_referer", '[^"]+'),
        '" "',
        Field("http_user_agent", '[^"]+'),
        '"',
    ]
)


@click.command()
@click.argument("input", type=click.File("rt"))
@click.option("--debug", type=bool)
def main(input, debug):
    parse = COMBINED_FORMAT.parse
    for line in input:
        line = line.rstrip("\n")
        data = parse(line)
        if data is None:
            if debug:
                sys.stderr.write(line + "\n")
            continue
        print(dumps(data, default=json_mapper))


if __name__ == "__main__":
    main()
Which generates something like:
{"remote_addr": "a.b.c.d", "remote_user": "-", "timestamp": "2023-02-09T23:00:29Z", "method": "GET", "path": "/feed.atom", "protocol": "HTTP/2.0", "status": 304, "body_bytes_sent": 0, "http_referer": "-", "http_user_agent": "Tiny Tiny RSS/21.06 (Unsupported) (http://tt-rss.org/)"}
{"remote_addr": "a.b.c.d", "remote_user": "-", "timestamp": "2023-02-09T23:02:31Z", "method": "GET", "path": "/img/wpa2-psk.svg", "protocol": "HTTP/2.0", "status": 200, "body_bytes_sent": 14068, "http_referer": "https://www.google.es/", "http_user_agent": "Mozilla/5.0 (Macintosh; Intel Mac OS X 10_15_7) AppleWebKit/605.1.15 (KHTML, like Gecko) Version/16.2 Safari/605.1.15"}
References
- Tracing: structured logging, but better in every way
- Shredding Deeply Nested JSON, One Vector at a Time
- newline-delimited JSON (NDJSON)
- JSON lines
- JSON Text Sequences, RFC7464
- VisiData
- pandas
jq- polars
- DuckDB
- Harlequin, a TUI IDE for DuckDB
- PRQL (Pipelined Relational Query Language)
- PRQL as a DuckDB extension
- jl